What is Real User Monitoring (RUM)?
Published 03 September 2020 11:27 (10-minute read)
Since the latest Google update about Web Vitals, search trends show an interest in optimizing real user experience. In this post, I'll explain what Real User Monitoring is and how you can use it.
TIP: start monitoring your user experience today! In May 2021, Google will update the ranking factors.
The simple answer to the question, "what is real user monitoring":
Real User Monitoring (of short RUM) is a method to collect user experience from real visitors from your website and store it in an application. This lets you collect information about how the users experience the loading of your website.
Unlike a general analytics program, like Google Analytics, which measures page visits and performs data sampling, RUM solutions focus on collecting all user experience data. RUM solutions also show the average and outliers of the collected data.
RUM is trending
I've embedded a snippet from Google Trends, where the latest search trends are shown.
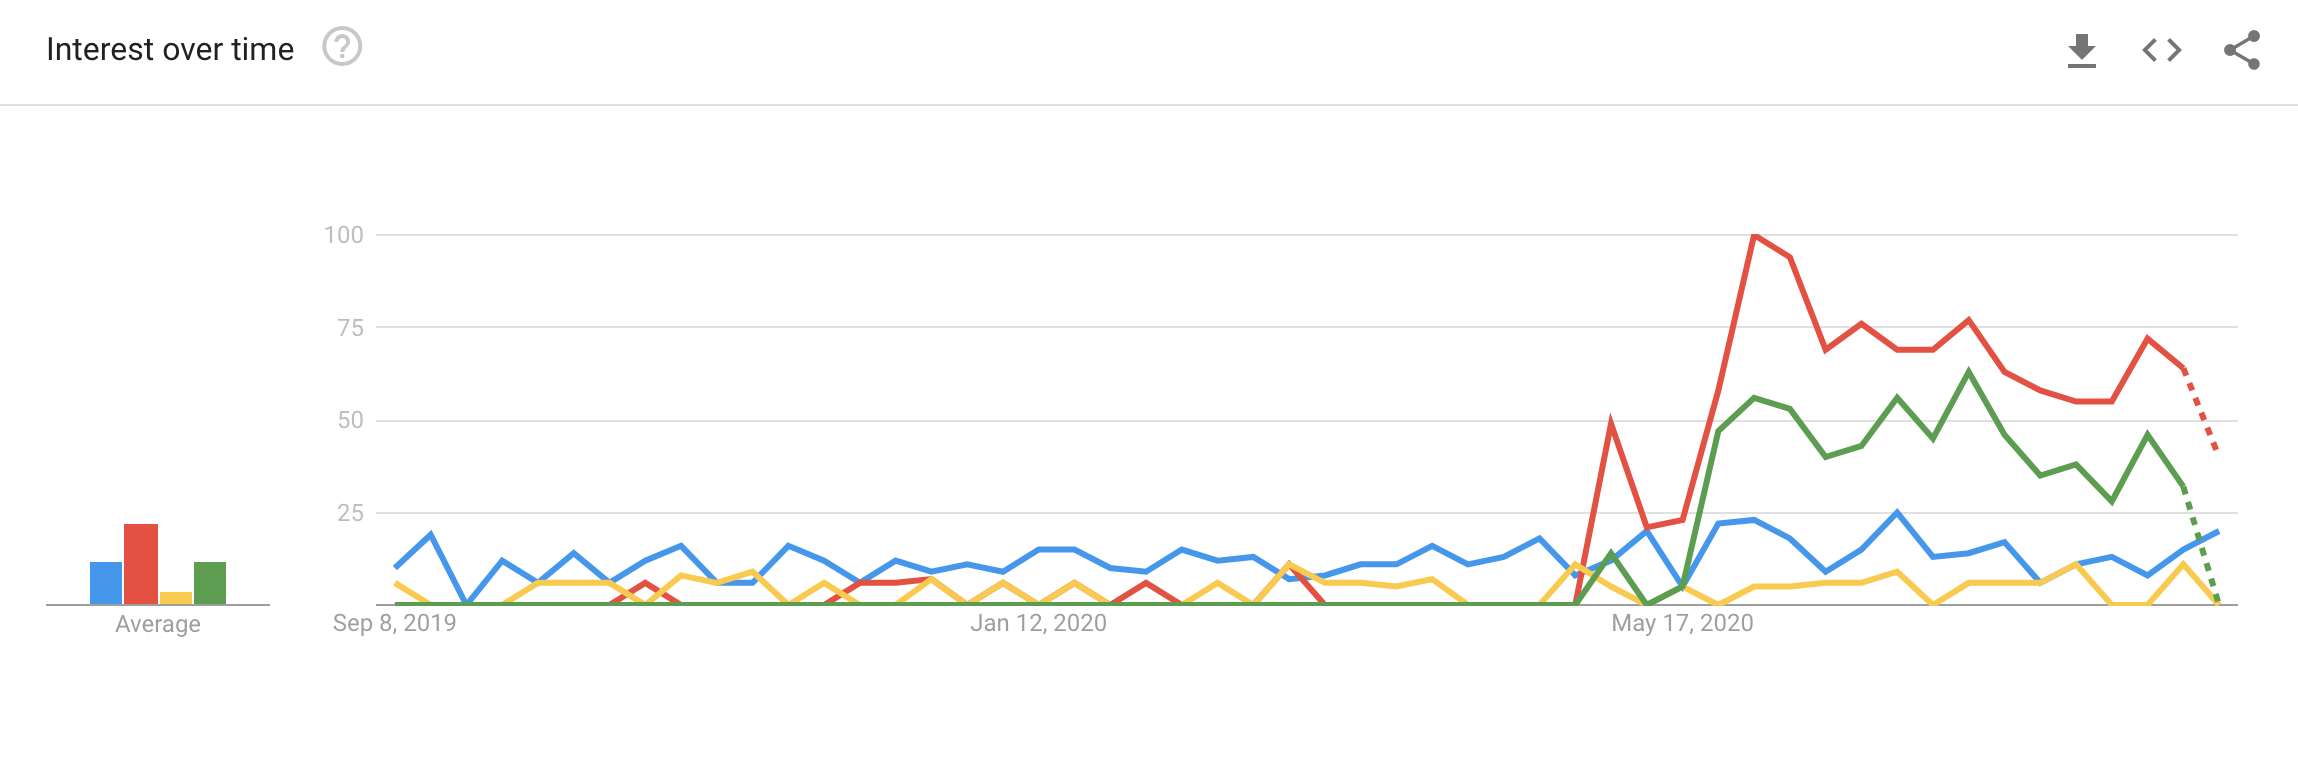
Google Trends for Real User Monitoring
Update Juli 2021
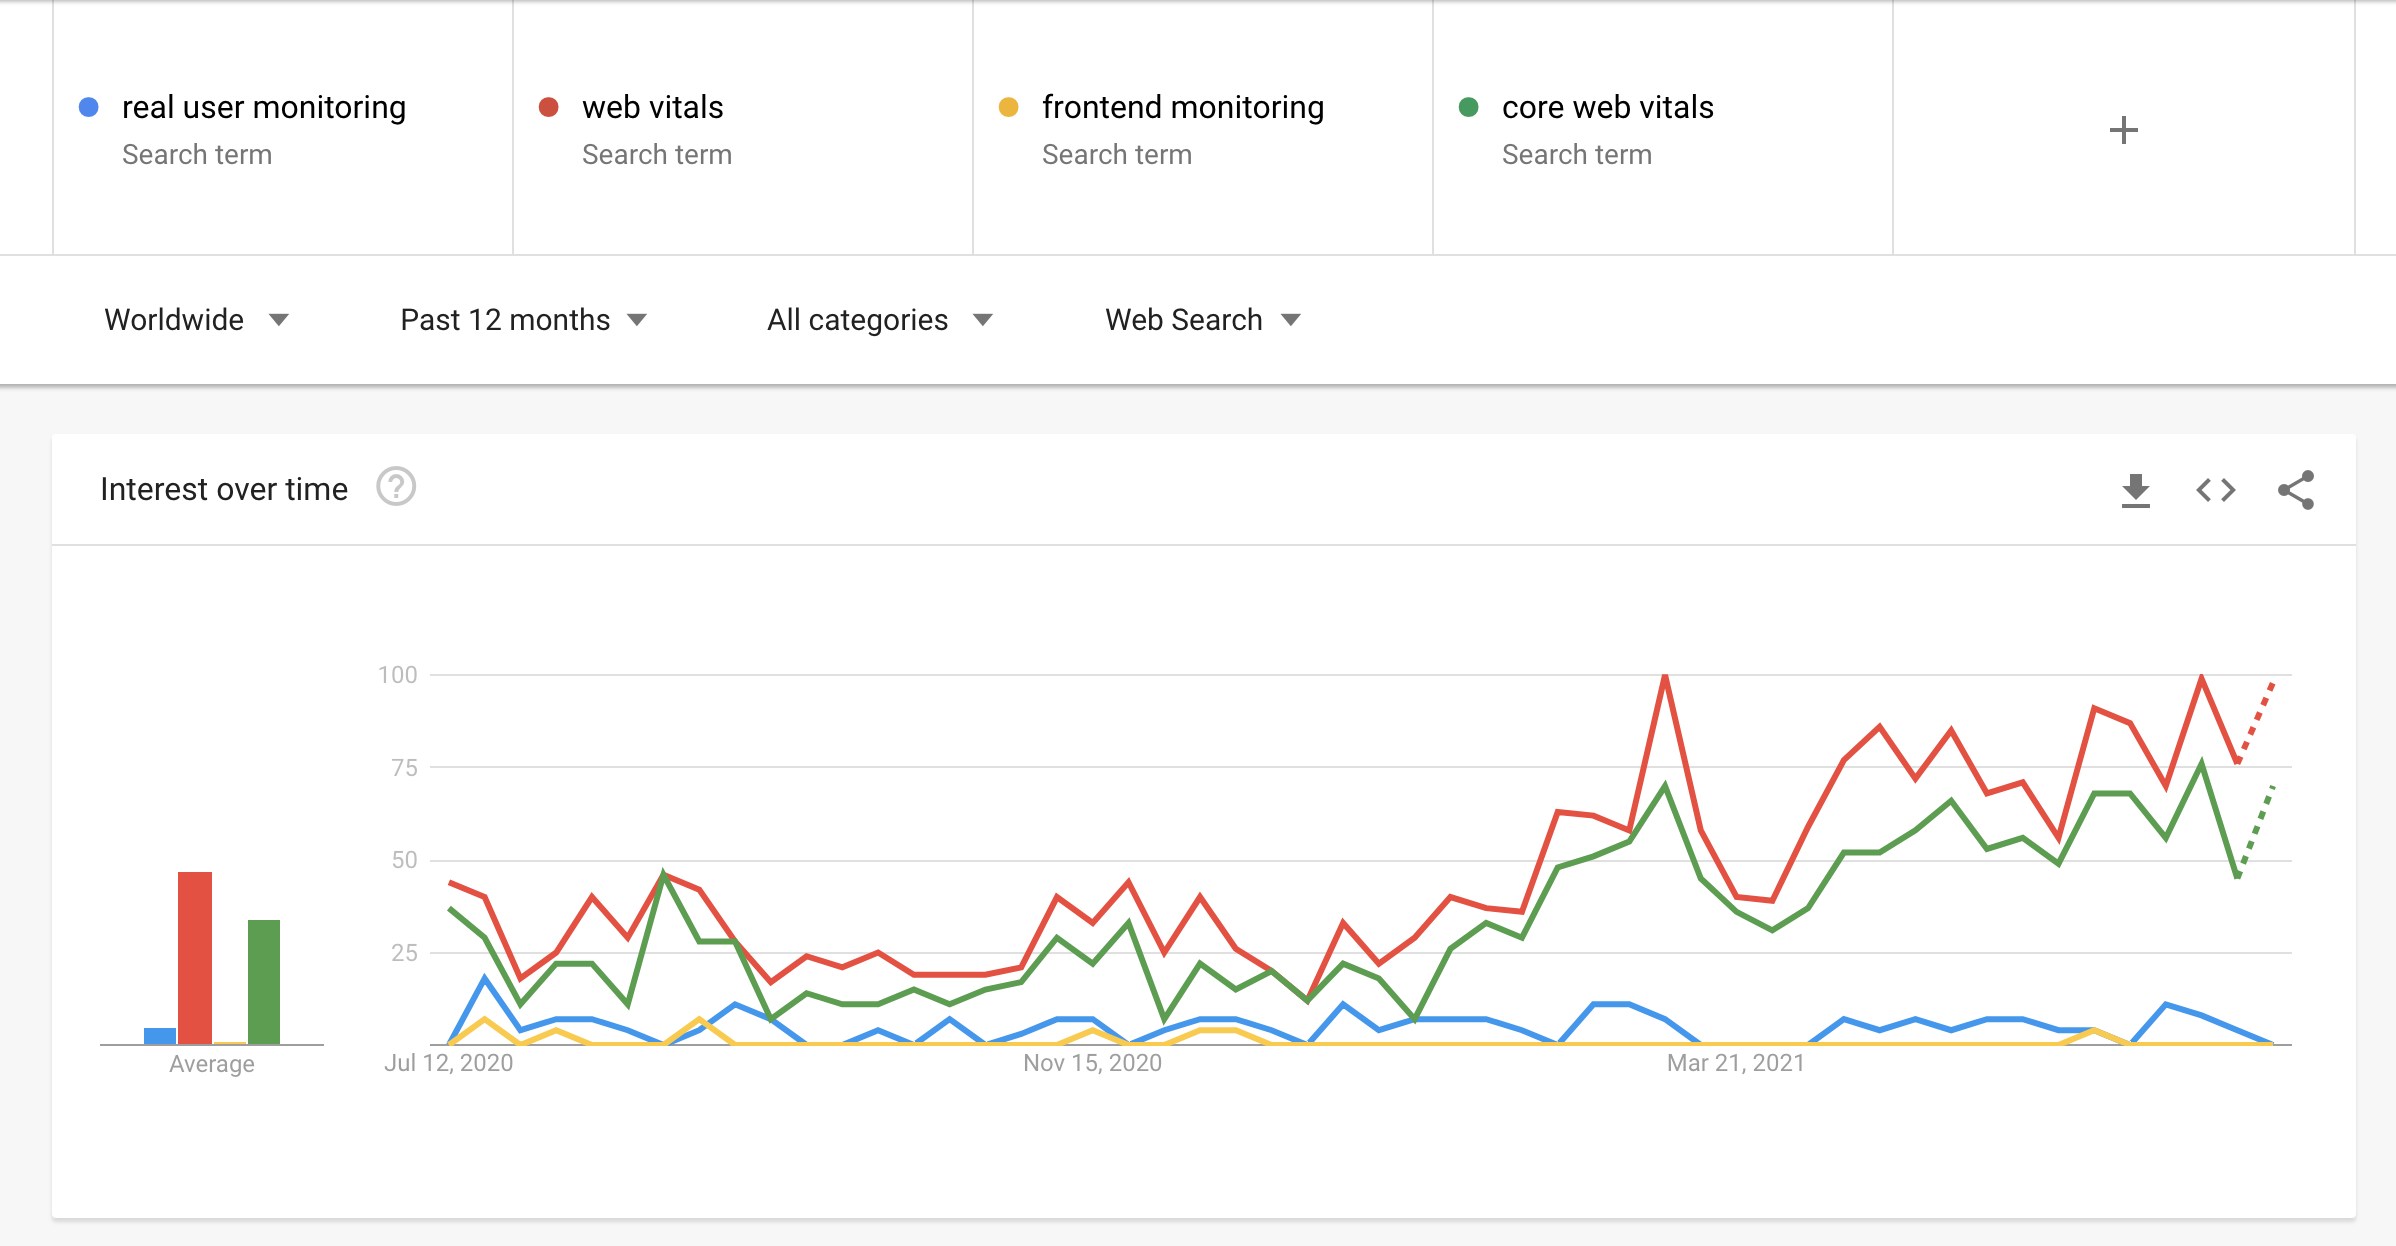
Google Trends results for Juli 2021
Ps, here is the link to view the real-time Google Trends report for the above dataset about the "Real User Monitoring" keywords.
Real User Monitoring vs. Synthetic Monitoring
The big difference between Synthetic (for example, Lighthouse) and RUM is the fact that you influence the environment of the synthetic tests. You exactly know what the specifications and conditions are of the server/client that is running the test. These things may consist of network speed, CPU, GPU, RAM, and geographic location. All those aspects may impact the synthetic test.
In the case of RUM tests, the user environment is unknown. They could have a bad internet connection or a really old device with low specifications. This means you are performing end-user monitoring for your website experience.
Some users even load your website (in the example hosted in Amsterdam) from a location on the other side of the world, let's say Sydney in Australia. When you don't use a CDN, the requests have to travel half of the world. This leads to (milli-)seconds of waiting time.
You can do multiple things to reduce the load time what will improve the user experience. I've divided the improvements into 2 groups.
- Server-side, for example: use a CDN, load balancer, DNS-based server usage.
- Client-side, reduce the image size, minimize the usage of CSS/JavaScript.
Do you want to learn more about website optimization? Take a look at this blog post from Cloudflare or visit web.dev for more tips/tricks about website optimization.

Do you want to measure the user experience of real users? That's Why is the new way of collecting RUM data in a privacy friendly way.
What is Web Vitals?
First, an introduction to Web Vitals. What is this, and how can you use them to improve your user experience on a website.
Web Vitals is an initiative by Google to provide unified guidance for quality signals that are essential to delivering a great user experience on the web.
Core Web Vitals is a subset of Web Vitals items (LCP, FID & CLS) that are the subset to focus on for 2020, and they may change over time.
Largest Contentful Paint
LCP: reports the render time of the largest image or text block visible within the viewport.

LCP threshold (image from web.dev)
First Input Delay
FID: measures the time from when a user first interacts with a page (i.e., when they click a link, tap on a button, or use a custom, JavaScript-powered control) to the time when the browser is actually able to begin processing event handlers in response to that interaction.

FID threshold (image from web.dev)
Cumulative Layout Shift
CLS: measures the sum total of all individual layout shift scores for every unexpected layout shift that occurs during the entire lifespan of the page.

CLS threshold (image from web.dev)
More information can be found on web.dev/vitals.
Besides the Core Web Vitals, there are others.
Time To First Byte
TTFB: identifies the time at which your server sends a response.
First Contentful Paint
FCP: measures the time from when the page starts loading to when any part of the page's content is rendered on the screen.
Total Blocking Time
TBT: metric measures the total amount of time between First Contentful Paint (FCP) and Time to Interactive (TTI), where the main thread was blocked for long enough to prevent input responsiveness.
Time to Interactive
TTI: measures the time from when the page starts loading to when its main sub-resources have loaded, and it is capable of reliably responding to user input quickly.
Why should you monitor user experience?
The simple answer, you want to earn money from your visitors. So why don't you want to know how they are experiencing your website?
When your visitors don't have a good experience on one of your pages, it's unlikely they are willing to try or buy your product. The first experience they have with your (online-)business can come via your website.
Is Google using Core Web Vitals as a Ranking Factor?
Google made a statement about using the Core Web Vitals as a ranking factor back in May 2020. They are planning to implement the Core Web Vitals as a part of their Search signals.
On November 10 (2020), Google announced that the Core Web Vitals would become part of the "Search signals for page experience." They plan to roll it out in May 2021.
Take a look at Core Web Vitals will become part of Ranking Factor (in June 2021)
This change may impact your organic (SEO) and advertisement (SEA) when it goes live in May 2021.
We believe user engagement will improve as experiences on the web get better -- and that by incorporating these new signals into Search, we'll help make the web better for everyone. We hope that sharing our roadmap for the page experience updates and launching supporting tools ahead of time will help the diverse ecosystem of web creators, developers, and businesses to improve and deliver more delightful user experiences.
Take a look at Google's press release on their blog.
How to monitor user experience?
Most modern browsers support a method to collect information from your website visitors like Google Analytics collects information about the visitors (or use a privacy-focused solution like Fathom Analytics). These statistics can be collected and stored on a system that collects all the user experience data. Based on this data, you can make changes and see if those are improving the user experience on your website.
If you don't want to store, aggregate, and monitor this yourself, you can use a SaaS solution that is doing this for you. You only have to pay for the pageviews you use, and they are storing, aggregating, and monitoring the user experiences. The main benefit is you don't have to worry about servers that collect all this useful information. They will do this for you.
How RUM works?
The methodic behind real user monitoring is not complicated. The logic behind it may look something like this:
- Websites monitor RUM data by implementing a JavaScript snippet into the source of the website.
- Every time a user visits the page, it will execute the JavaScript code, which collects the data.
- The moment a user interacts or leaves the site, it will send the data to a collector.
- This collector processes all the incoming data from the visitor and stores it in a database.
- When the site owner wants to improve the user experience, he can take a look into a dashboard to see which pages need some improvement.
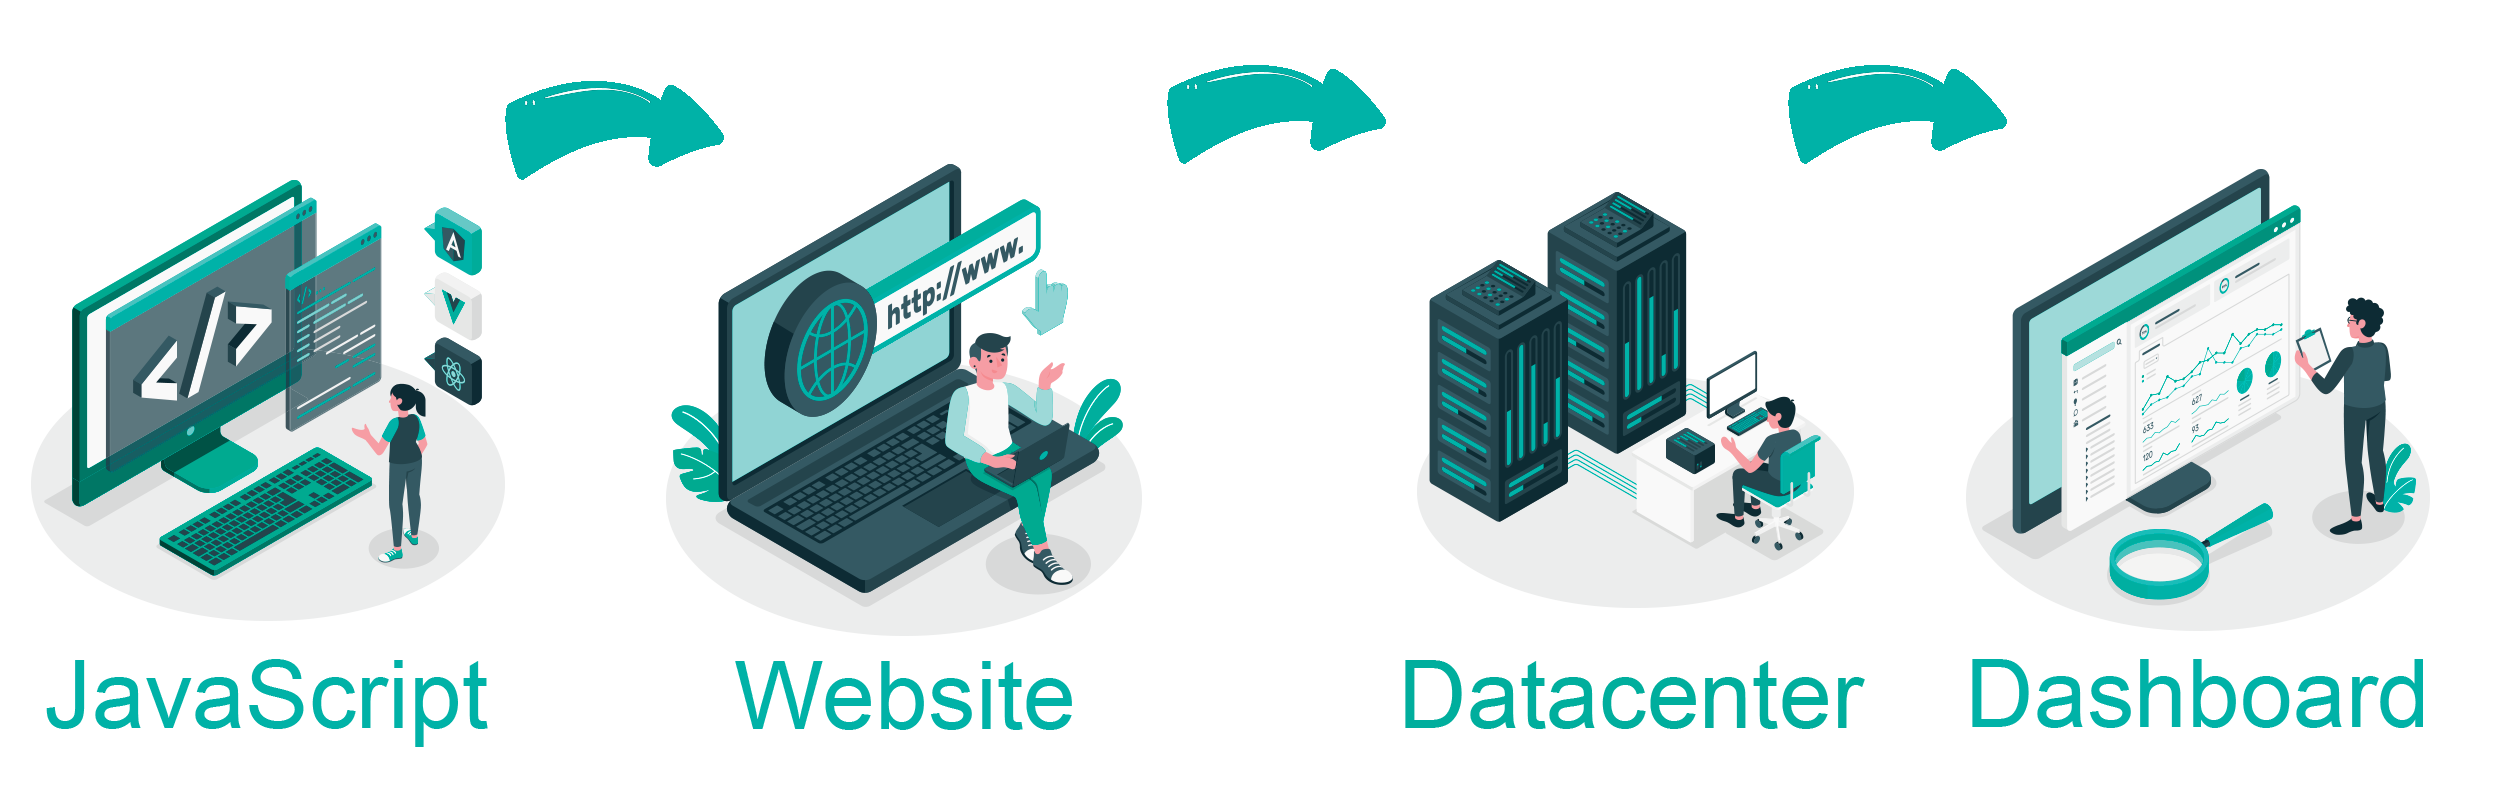
Illustration on how RUM works
Core Web Vitals in Search Console
If your website has enough traffic (visitors that are using the Chrome browser), it may be possible that you see "Core Web Vitals" data appear in your Google Search Console.
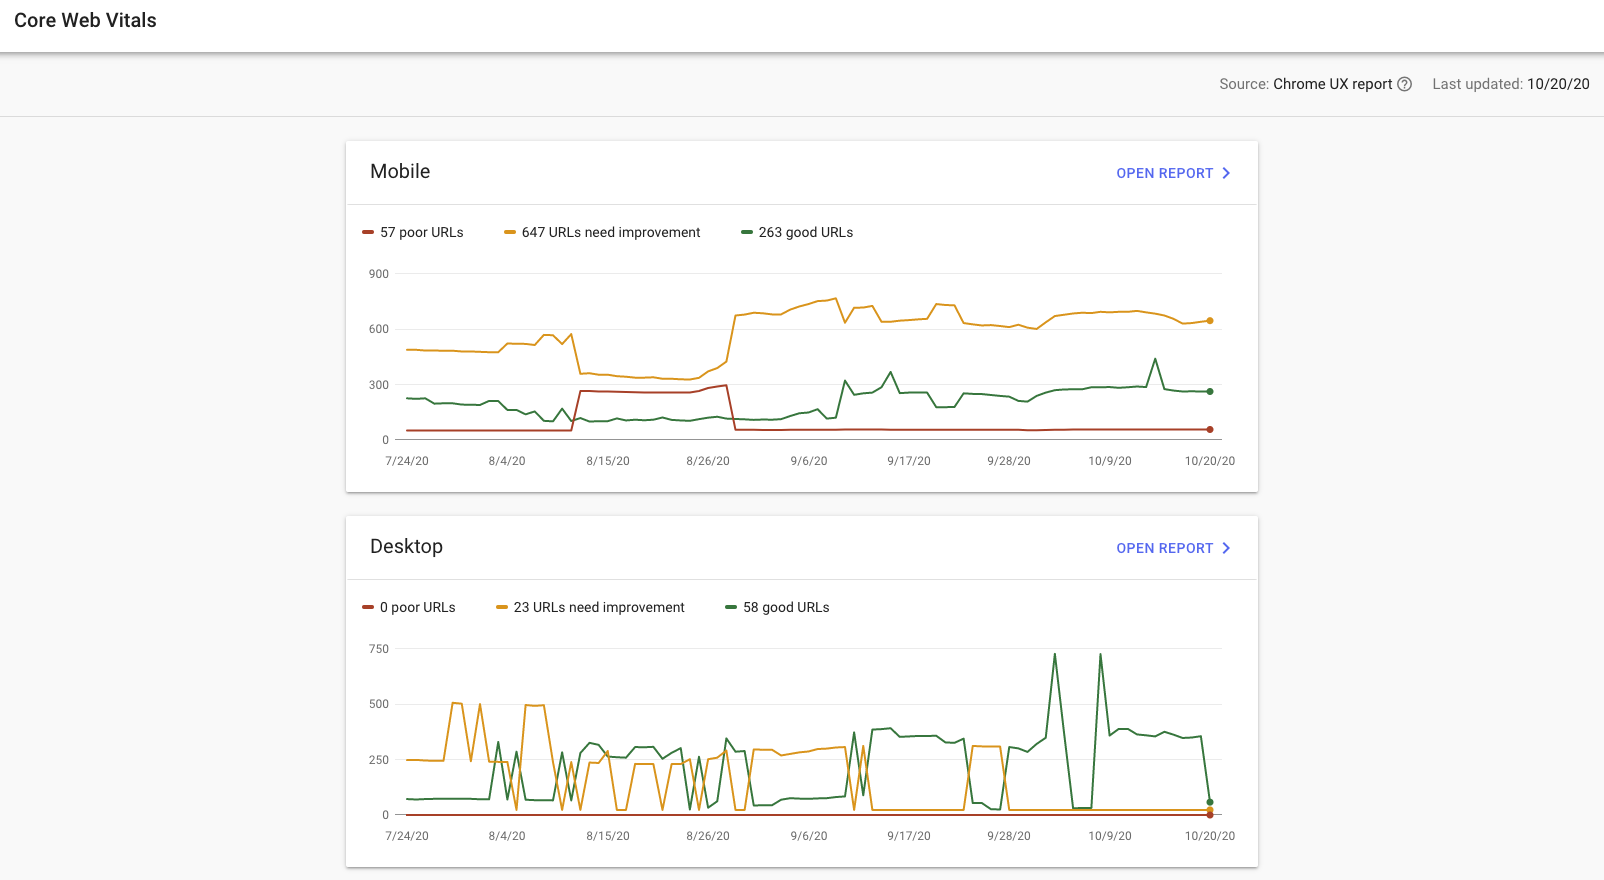
Core Web Vitals report in Google Search Console
As you can see in the image above, the results are changing all the time. This because Google doesn't measure all the page visits to your website, only a small percentage of all visitors. This is because they only collect it from users that are using the Chrome browser.
Data for the report comes from the Chrome User Experience Report. This reflects actual usage data on your site from users around the world. (source: Google Search Console)
When you take a look into the documentation on the Google support site, it states:
Report data sources: The data for the Core Web Vitals report comes from the CrUX report. The CrUX report gathers anonymized metrics about performance times from actual users visiting your URL (called field data). The CrUX database gathers information about URLs whether or not the URL is part of a Search Console property.
So now you can see this information nicely. But you only know which pages on which devices are running slow and need improvements for the user experience. At the time of writing, it's not possible to see in Search Console which users (based on country or device type) have a bad user experience. It may be possible that those results are from a country that's far away from your server. This means you may need to add a worldwide network of servers for your website.
I created a free tool you can use to check your Chrome User Experience Report (or, in short: CrUX). It loads the real user monitoring data collected by Google without adding your site to Google Search Console.
Single Page Applications
Since Google measures single-page applications and traditional (without front-end page loading) websites with their Chrome User Experience Report (CrUX), it could impact your search engine ranking. Single-page applications don't trigger a new page load, which could mean the CrUX report gets a high CLS and/or LCP.
This issue is known by more developers/web analysts (like Simon Hearne on Twitter). He asked John Mueller about how this impacts the ranking in the search results. At the time of writing, it's not clear how SPA applications will be impacted in a positive/negative way:
I don't have any special insights there. For Search, we do [well, when the change is live] focus on the data from CrUX, we don't do anything special for specific sites / kinds of sites. (John Mueller on Twitter)
With That's Why Real User Monitoring, it's possible to measure the user experience of single-page applications. Unfortunately, due to browser limitations, it's not possible to provide an easy way to measure all aspects for each page.
Browser loading predictions
Also, Google announced back in 2019 that it's testing a feature in the mobile browser Chrome to indicate loading time for that website based on other users' experiences. Based on the blue or green loading bar, users can see how fast the page normally loads.
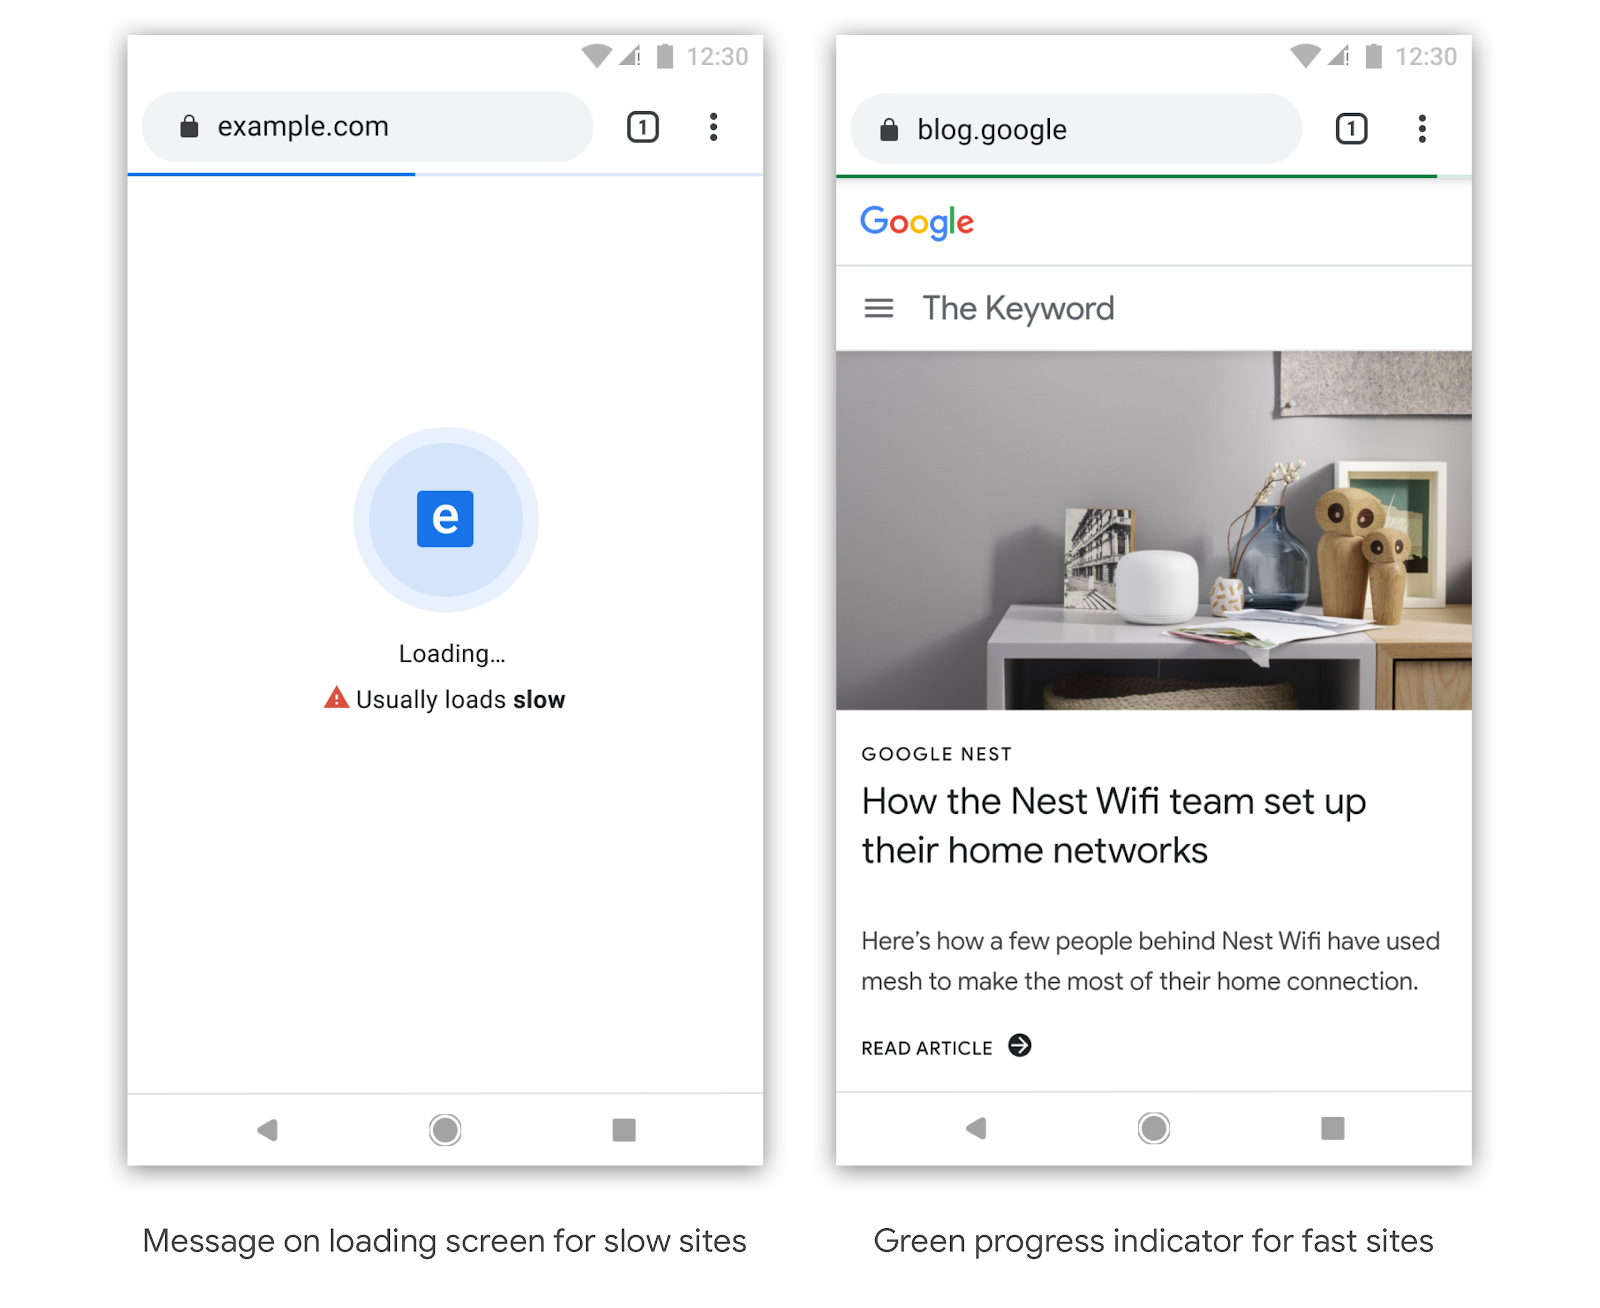
Google Chrome on mobile shows loading time (from blog.chromium.org)
RUM SaaS solutions
When you search for RUM, you likely get the drink that's called "rum." But that's not what we need. We want "Real User Monitoring" solutions, so what are the possible SaaS solutions you can use on your site to collect user experience information? You can read more in the post "Real User Monitoring tools."